Stormwater
Stormwater is the pluvial water that runs off the surface. The requirement of physical structures to carry or contain the stormwater in order to avoid flooding in the catchment area is essential and in fact, such structures are integral part of urban development works.
In an urban stormwater context, a feasible network of drainage network comprising structural elements, such as conduits, manholes, detention tanks, sustainable urban development structures (SUDS) are conceptualized. The sub-catchment area (A ha) is delineated at each entrance of the network to cover the entire area under study. The frequency analysis is carried out from historical peak K-day rainfall data of the urban area, where K=1; in general. The peak rainfall (RT mm) for various return periods (1 in T-year, where T = 1 to N) are the direct results of the frequency analysis. From these rainfall of various frequencies, the rainfall-intensity values from 1-hour to 24-hours are computed. It is to be noted that some countries with scanty rainfall data, generally, publish the isopluvial maps of K-day rainfall to deduce RT. As the sub-catchment is usually small, the time of concentration tc (hour)is also small. Therefore, the storm of lesser duration becomes more significant and it is reasonable to consider the storm duration, Td= tc. With the application of suitable empirical methods, the intensity-duration-frequency curves are generated and the short term rainfall-intensity (IT mm/hr) corresponding to the tc is determined. Finally, applying the rational method, the design discharge (QD m3/s) from the sub-catchment for a storm water system design is given by, QD = (C * IT * A)/ 360,where C is the runoff co-efficient of the sub-catchment. In other words, QD is merely a derivative, whereas R is formed through an additive process. The carrying capacities of the drainage structures, the detention structures, the retention structures et al are primarily determined from the design discharge, QD. When the network is large, generally, the hydraulic modelling of the stormwater network is carried out with the given hyetographs derived from the rainfall-intensity, IT as input to the model, thereby generating runoff hydrographs, which are hydraulically routed in the network. Various outputs are resulted from the hydraulic model, which include the peak discharge and depth of flow at any point in the network. A wide range of stormwater network modelling software is available in the domain and is used for various urban projects.
Hydro-economic analysis
Now, the question is not about the efficiency of the design or modelling procedures, it is, in fact, about the input. To simplify, the question is – “what is the T-year storm for which the stormwater system shall be designed?”. There are multiple answers to this question. Various nations apply structure based selection of T-year storm referring to guidelines, standards, and codes. Some countries go further to release geo-spatial map displaying the flood risk zones of various frequencies. As optimization is the key to such problems, the hydro-economic evaluation of structures of the storm water system become inevitable to address. In hydro-economic analysis, the type of structure and estimation of the construction costs and damage costs with respect to the various T-year storms (return periods) are the key parameters to arrive at optimum design storm period; an example plot has been displayed below:
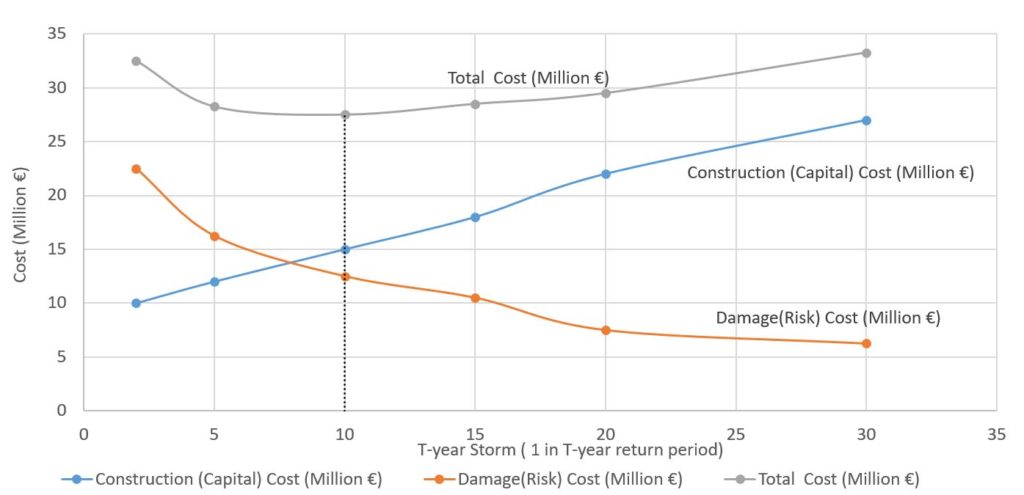
From the above figure, it could be inferred that the total cost, which is the sum of the construction (capital) cost and the damage (risk) cost, is minimum at 1 in 10-year return period. Hence, 10-year storm is reasonably treated as design storm for project purposes. Subsequently, structures are constructed as planned and designed. For example, if a 10-year storm is the design storm of a project, it indicates that the 10-year storm will normally occur only once in every 10 years; which does not imply that a 10-year storm would not occur immediately in the same year after the occurrence of a 10-year storm. In fact, every year carries the same probability, 1 in 10, of producing a 10-year storm, even in the same catchment that was hit by a 10-year storm in the previous year.
Causative factors of problems
It is a common convention that in the event of a storm greater than that of a T-year one, the flooding on the streets and the sub-catchment are to be controlled by different means, such as pumping the water out of the sub-catchment etc. It means that at a higher storm event, the problem shifts from design to operation and maintenance (O&M). In principle, the O&M is an essential requirement because at the time of design if design storms are chosen beyond the optimum one, it would, in general, be in contrast with the available space allocated for the system’s (network) placement. Therefore, the constraint of space allocation is unavoidable. If the O&M has been consistent in the smooth functioning of the system and even after that the system encounters recurrence of damages due to flooding, the problem is thrown back to the design and then this equivalent game of ping-pong between the design and the O&M continues to the extent that many decades are lost in resolving the actual problem.
Much more time is lost when it is realized that there exists a design problem because those (engineers, scientists, climatologists, etc) who realize the problem, usually take time to find the cause of the problem. Instead of investigating the internal fundamental causes, they, generally, give importance to the external causes. Out of many such external causes they might have investigated, they come up with the latest one known as “climate change”. Many countries have taken it seriously and they have refurbished their flood risk zone map considering the climate change. Though it adds value, what if the fundamental causes have much bigger impact than the climate change? The subsequent sections illustrates the one of such causes.
For example, based on Fig-1 if a storm water system is approved and constructed, what could possibly be wrong with Fig-1 that the constructed structure might fail? Ideally, before jumping onto the climate change, the investigation begins here. Now, looking at the construction cost curve, it is presumable that the current rates of the material, machinery, labour etc. might have been applied to plot the curve and it is reasonable to do so. But if the same principle of current rates are applied in the damage cost curve, it is invitation to trouble. How??
Let us say that the design life of the constructed drainage structure is 35 years, the design storm is 1 in 10 -year (10-year storm), and after 2 years of construction of the storm water structure a 100-year storm hits the sub-catchments. What would be the immediate consequences? The answer is flood inundation in the sub-catchments followed by O&M works. In this case, normally, the structures are designed to sustain the overflowing, thereby spilling out to the sub-catchments and to sustain temporary submergence. If the sub-catchments are not made resilient to a 100-year storm event, the inundation due to the event would damage the built-up, the paved, and the non-built-up areas in the sub-catchments. The overflowing of drainage itself displays that the system is dysfunctional; however, temporarily. After the O&M conduction the functionality is regained. If serious damages to structures are witnessed and in addition to that if the sub-catchments are not resilient to the said storm, the damage would surge. And this damage occurring after 2 years of construction would not justify the 10-year design storm because the damage cost considered during the optimization of design storm might have been based on the rates that were scheduled for the construction till the construction period, meaning that the escalation of rates in a futuristic scenario to be applied in the damage cost might have been neglected. This, invites trouble!
Re-evaluation of hydro-economic analysis
At least the design life may be kept as the horizon to estimate the damage (risk) costs, which when plotted against the return period, will give the actual damage cost curve. This would lead to new total cost curve, thereby a shift in the design storm return period as displayed below:
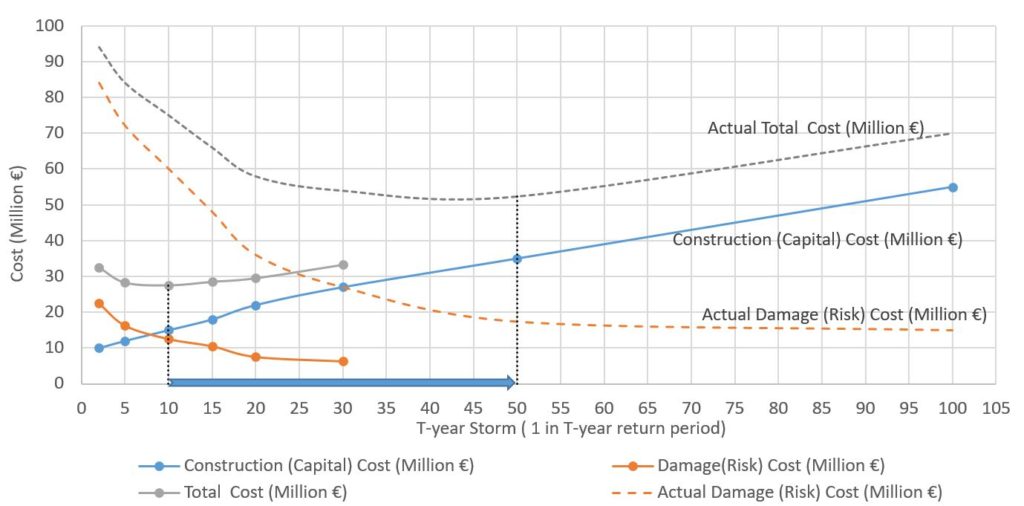
The Fig-2 is the extension of Fig-1, where the construction cost curve of Fig-1 has been extended till 100-year storm, whereas the curves representing the actual damage cost and final total cost have been shown in the plot. In the given example, the comparative plot displays the shifting of 10-year storm (1 in 10-year) to 50-year storm (1 in 50-year). Now, where does the impact of climate change on flooding in the example lie in the above plot? Hypothetically, the damage cost curve due to climate change would have resulted in the optimum return period between 10-year storm and 50-year storm; somewhere close to 10-year storm (say). In other words, if the actual damage cost is missing, the impact of it is much more than that of the damage incurred by the climate change.
Conclusion
Some of the anticipated impacts of the climate change on urban flooding are – rise in mean sea level, change in river regimes and increase in peak discharges of rivers, and increase in annual rainfall and in peak rainfall; the overall impact is in the range 10% – 45% per century (Schultz, 2020). Comparatively, some of the impacts of human activities on urban flooding are – increase in value of public and private property, increase in population, and increase in value of crops; the overall impact is in the range 100% – 1000% per century (Schultz, 2020). Therefore, let the climate change alone be not an alibi or an excuse to the urban flooding and to the consequent structural failures. In urban flooding, the insight to the problem identification is more important than highlighting the mediocre problems unless they become dominant problems.
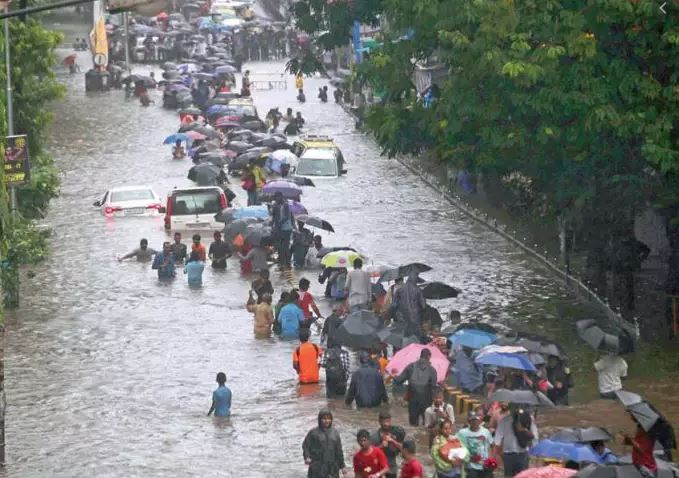
Somebody said, “if you wish to know how good a city is; visit the city when it rains”.
Author – Pradyumna Machhkhand ; email: pradyumna.machhkhand@ghyiae.com